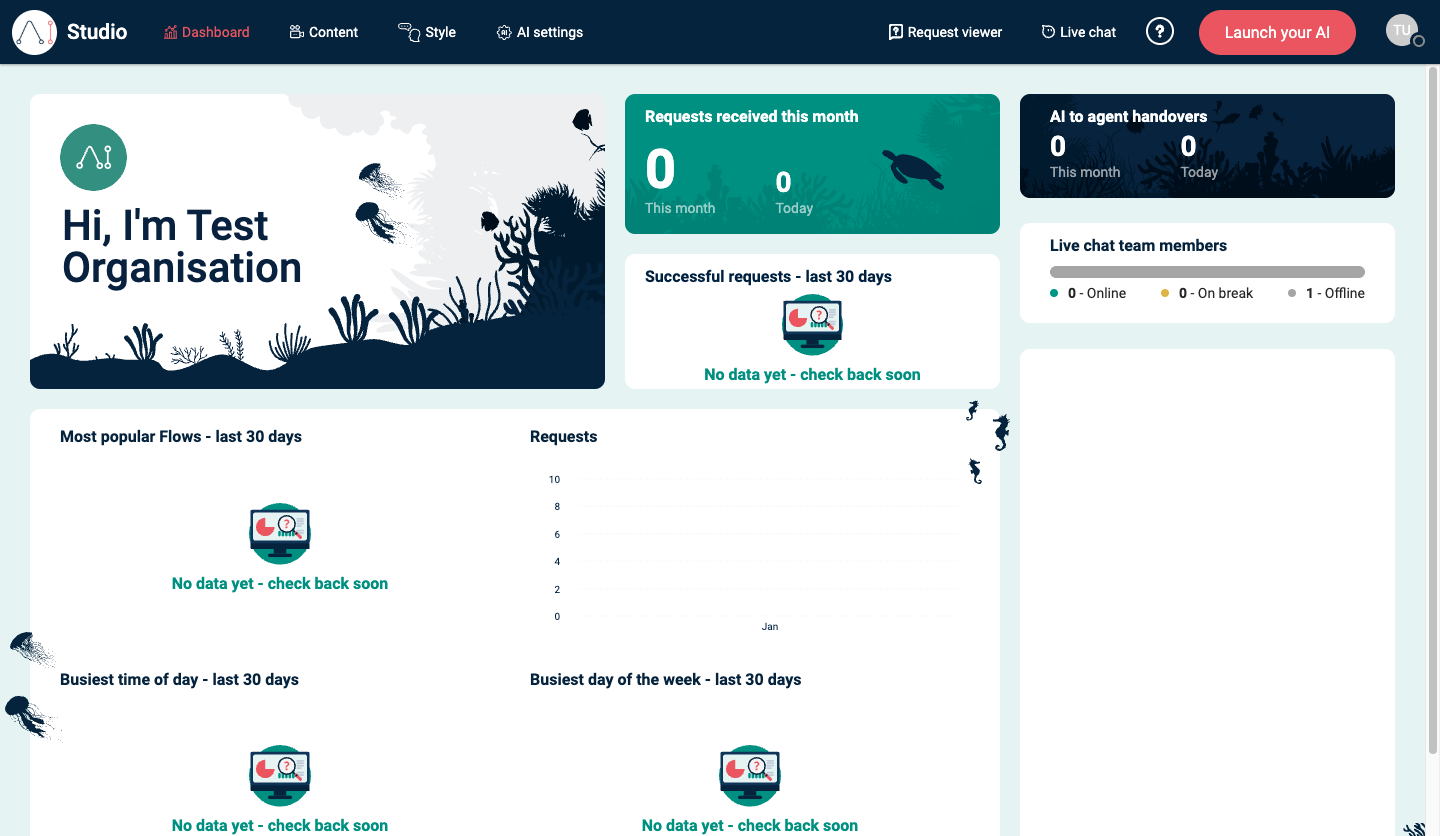
Dashboard overview
Review activity and spot improvement opportunities in EBI's AI Studio Dashboard.
Outcome
By the end of this guide you will know what to check first in Dashboard, what empty panels mean, and when to set up live chat.
Prerequisites
- You can sign in to EBI's AI Studio
- You have published or tested your AI assistant if you want the Dashboard to show activity
Steps
1) Open Dashboard
- In the top navigation, select Dashboard.
- Review the headline panels at the top of the page.
2) Decide whether to set up live chat
If you see Set up live chat now, live chat has not been set up for the assistant yet.
- Select Get started if your team needs human agents to answer chats or receive AI-to-agent handovers.
- Leave it for later if you only need the AI assistant to answer using flows, generated responses, and information sources.
After live chat is set up, Dashboard can show live chat information such as AI to agent handovers and Live chat team members.
3) Understand empty panels
Dashboard panels can show No data yet - check back soon when there is not enough activity for that panel.
This is normal for a new assistant, a test account, or a feature that has not been used yet. For example:
- Most popular Flows - last 30 days needs requests that match flows.
- Successful requests - last 30 days needs reviewed request data.
- Busiest time of day - last 30 days and Busiest day of the week - last 30 days need enough request activity to show a pattern.
- Live chat panels need live chat to be set up and used.
For a specific test message, use Request viewer. Dashboard is better for trends after there has been enough usage.
4) Review the most useful panels first
Use these as your “first pass”:
| Panel | Use it to check |
|---|---|
| Requests received this month or Conversations received this month | Baseline usage and today's activity. |
| Most popular Flows - last 30 days | Which flows users reach most often. |
| Successful requests - last 30 days or Successful conversations - last 30 days | Whether requests are being recognised correctly. |
| Requests or Conversations | Activity over time. |
| Busiest time of day - last 30 days | When users are most active during the day. |
| Busiest day of the week - last 30 days | Which days have the most activity. |
| AI to agent handovers | How often the assistant sends users to live chat. |
| Live chat team members | Whether live chat agents are online, on break, or offline. |
5) Turn insights into actions
- Pick the top 3 gaps (high volume, low success, repeated handover).
- Improve the experience:
- Add or refine a flow in Content → Flows.
- Add sources in Content → Information sources.
- Review live chat coverage if handovers are high or concentrated at busy times.
- Select Publish (flows) and retest.
Verify
- After sending a test message, you can find it in Request viewer
- Dashboard panels move off No data yet - check back soon once there is enough relevant usage
- Set up live chat now is optional unless you want live chat handover or agent support
Common issues
- Everything says “No data yet”: you may not have enough conversations yet; check again after your AI assistant has been live for a while.
- A test message does not appear in Dashboard immediately: check Request viewer first. Dashboard is designed for summary trends.
- You see Set up live chat now but do not use live chat: you can leave it for later. The AI assistant can still answer with flows, generated responses, and information sources.
- Numbers look wrong: confirm you are comparing the right time window, such as Today, This month, or last 30 days.